Update: 4/11/2026
We used a total of 10,657 kWh of electricity in the year January 2025 through December 2025 and during the same period, the solar electric system generated 10,546 kWh, which was 94.7% of our total usage.
The graph below shows our electrical usage from January 2025 through December 2025. The solar energy generated is shown in green and the Dominion energy purchased or returned in red. Negative values for the Dominion energy reflect the excess of generation over usage which was returned to the Dominion electrical grid. Our generation exceeded demand for 8 months of the year; only during the winter heating months (January, February, November, and December ) did we actually draw more energy from Dominion than we generated. We used 2.5% less electricity in 2025 than in 2024 and produced 4.5% less.
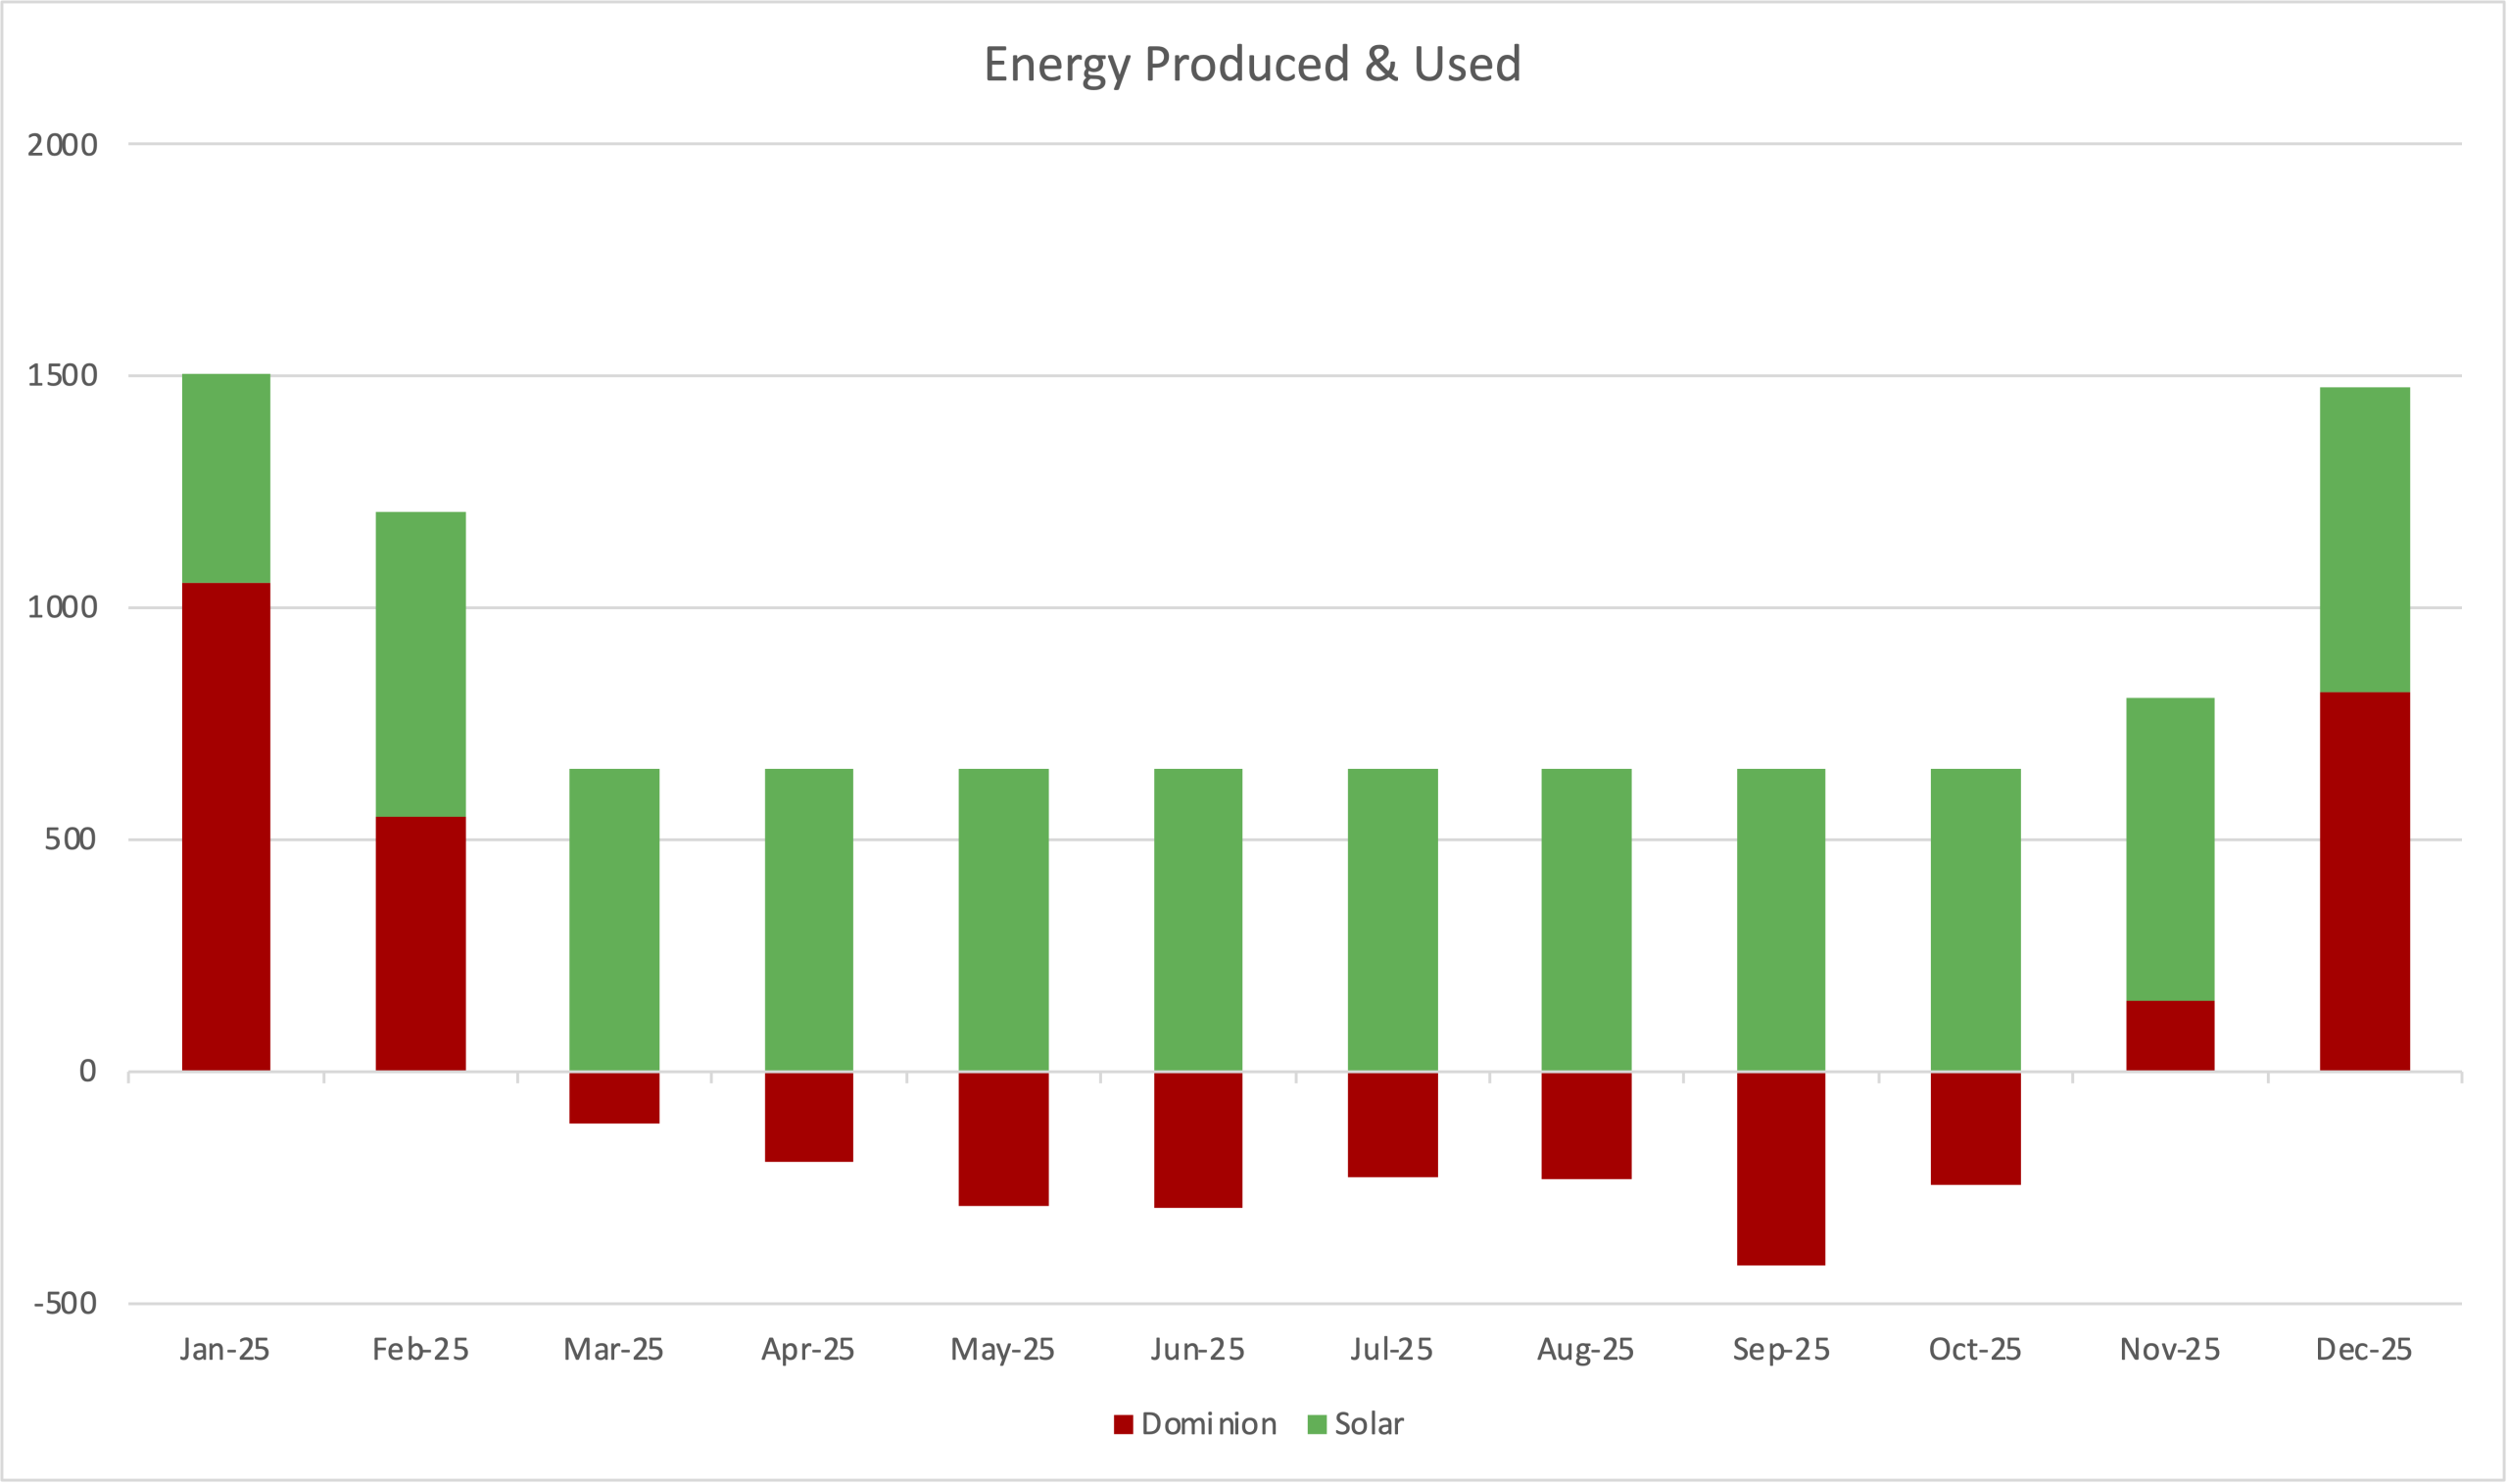
The maximum daily energy generated during the year was 49.6 kWh on May 13, 2025 while the minimum daily production was 0.0 kWh on January 6, 2025, when there was snow.
Historical Energy Usage and Production
This table shows our energy usage and energy production for the calendar years since the final system was installed.
| Year | Total Energy Used (kWh) | Total Energy Produced (kWh) | % Produced |
| 2023 | 10,930 | 11,082 | 101.4% |
| 2024 | 10,930 | 10,546 | 96.5% |
| 2025 | 10,657 | 10,092 | 94.7% |
Update: 6/21/2023
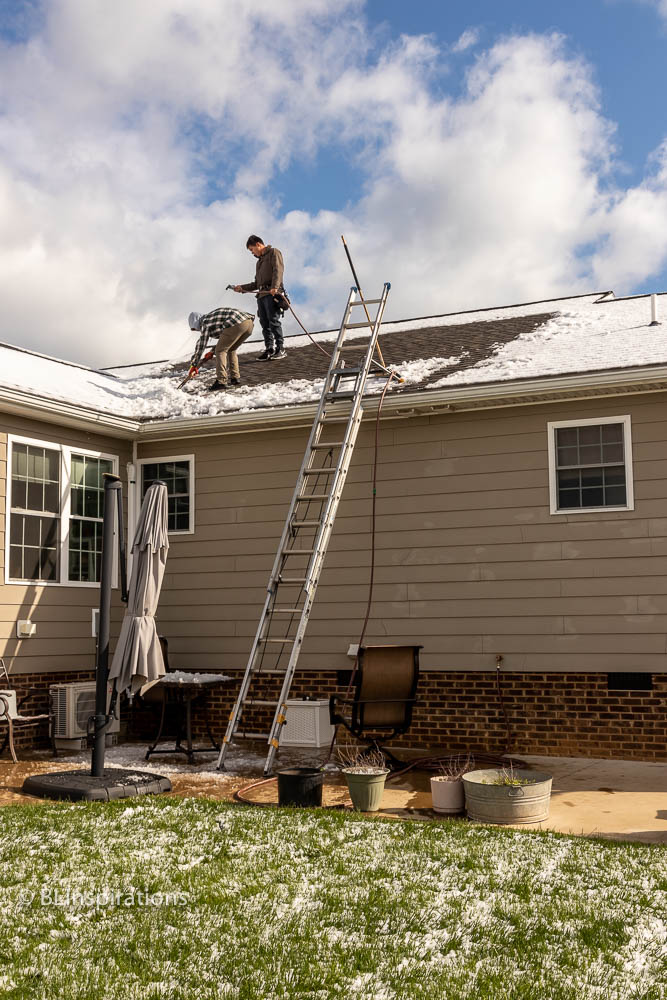
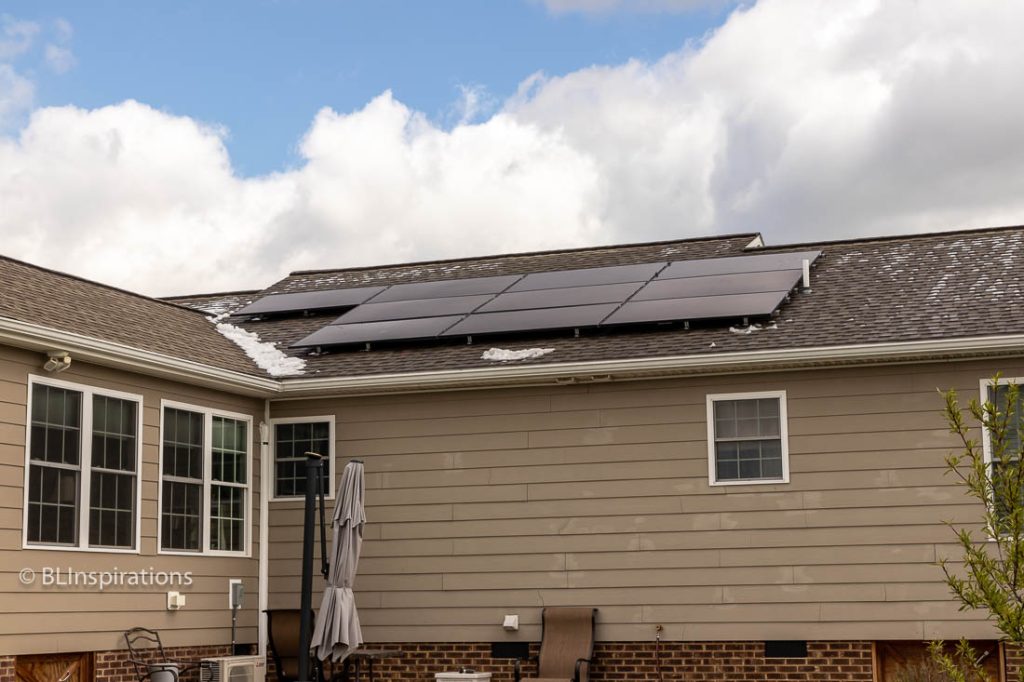
We had a second set of solar panels added to our solar electric system in April 2022. The addition consists of 10 – 400 Watt solar panels, each with its own microinverter, along with mounting, wiring, and monitoring equipment. The additional panels are rated at 4.00 kilowatt (kW) DC (direct current) and are guaranteed to produce at least 5189 kilowatt-hour (kWh) of AC power during each of the first three years.
It had snowed the night before the new panels were installed so the installers had to clear snow from the roof first. The photos below show the roof being cleared and the installed solar panels.
Original Post
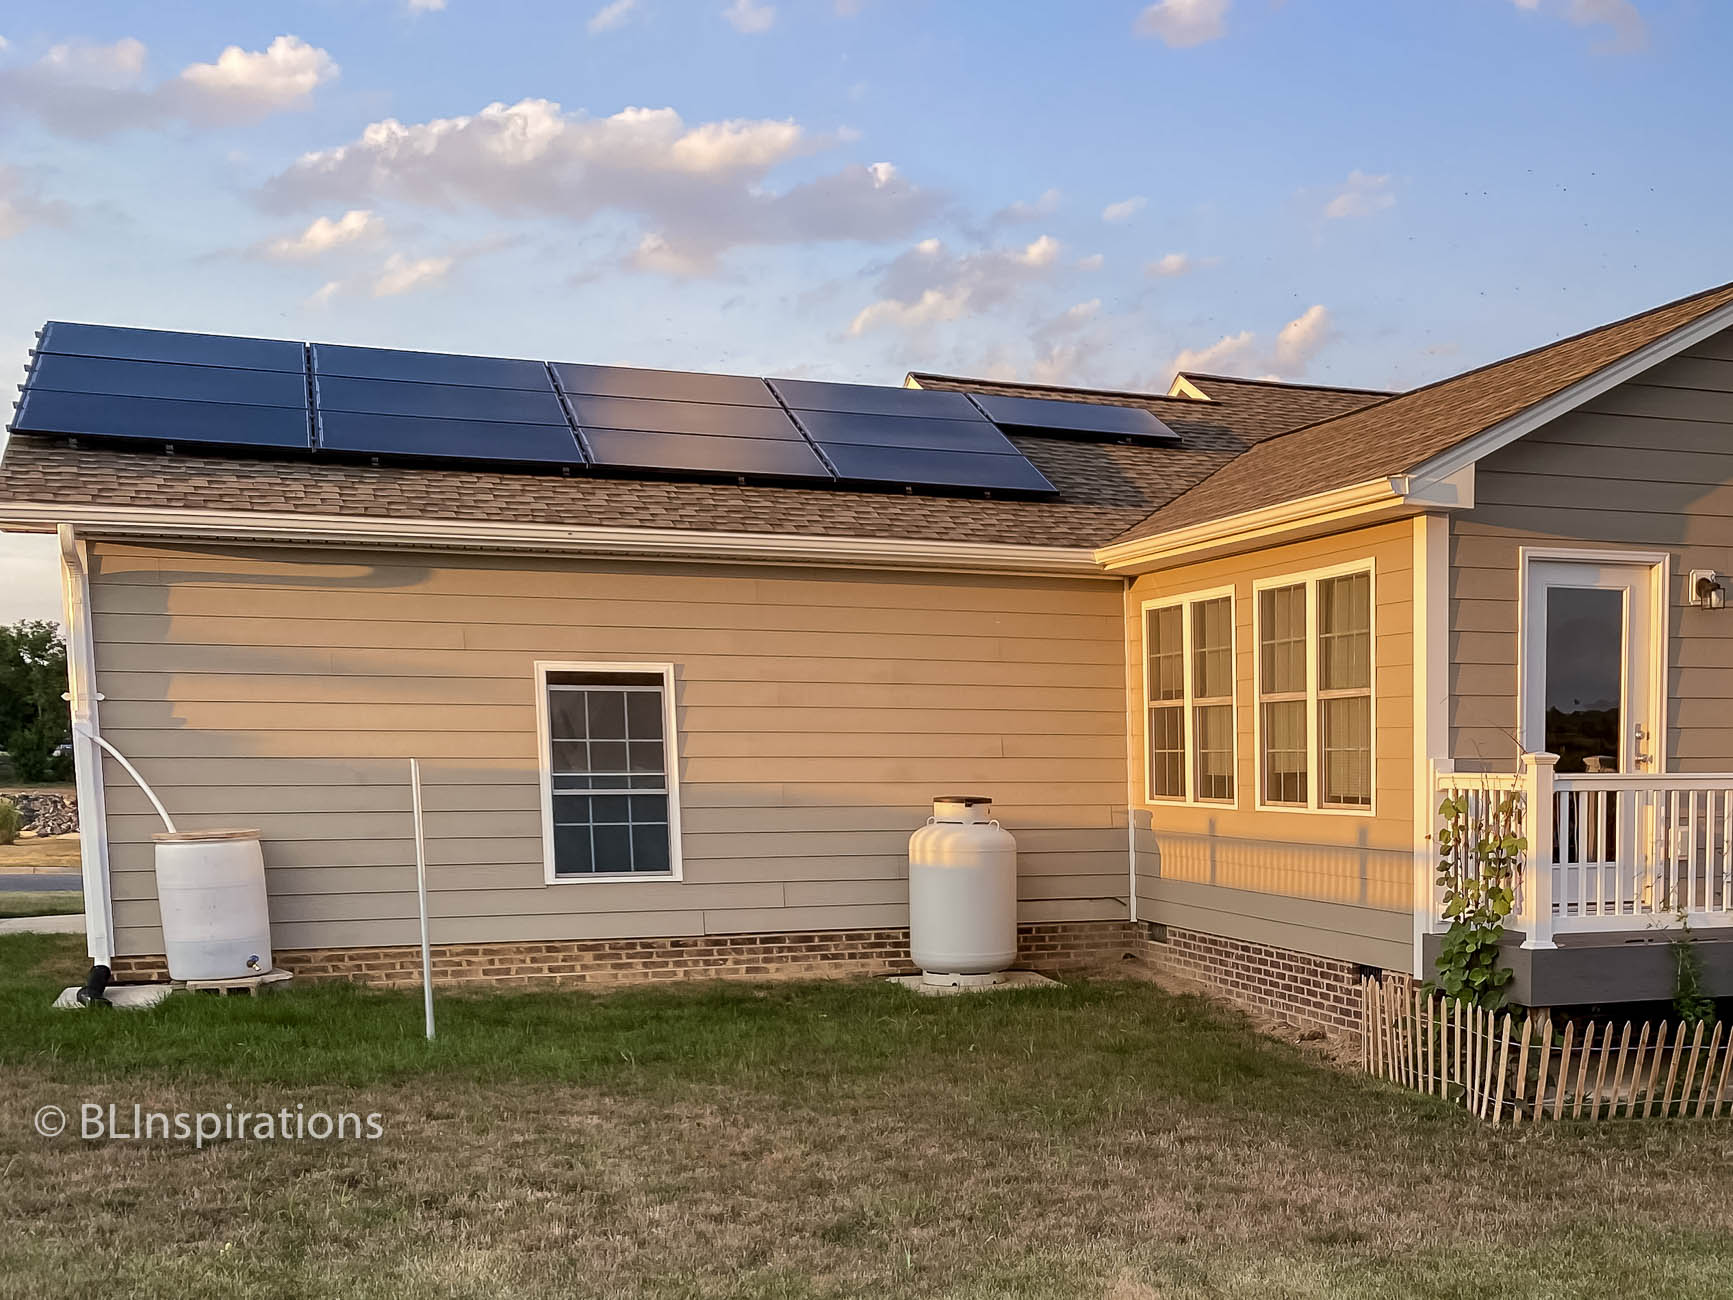
We had a photovoltaic (solar electric) system that generates electricity installed by Sigora Solar of Charlottesville, VA last July. The system consists of 13 – 320 Watt solar panels, each with its own microinverter, along with mounting, wiring, and monitoring equipment. The system is rated at 4.16 kilowatt (kW) DC (direct current) and is guaranteed to produce at least 5509 kilowatt-hour (kWh) of AC power the first year. The system was sized to produce 94% of our estimated annual electricity usage – the reason it’s not larger relates to the limits of Net Metering (see the Net Metering section below). The vendor’s calculated payback period was about 8.5 years, including electricity savings, tax credits, and Solar Renewable Energy Credits paid by the utility to the homeowner. In addition, a solar electric system increases the value of the property when it is sold – the current average is about 4%. That amount wouldn’t cover the entire installation cost but about 70% in our case.
Once the installation was completed and everything was working properly, the system was turned off until the county inspection and the utility’s meter replacement and Authorization to Interconnect and Energize were complete. The system started producing power early in August and on sunny days we enjoy watching the reading on the digital electric meter get smaller, as the system produces more electricity than we use. During the first full month of operation, our average electric usage from the utility was about 2 kWh per day and the average energy produced by the system was about 17 kWh/day. The most energy produced in one day was 26.6 kWh while the least was 1.1 kWh on a rainy day. Previously, our average electric usage ranged from 18 to 31 kWh per day depending on the season. Initially, we tracked the utility meter reading each day to familiarize ourselves with the system and to understand the effect of the weather on the energy produced. It has been interesting to see that the meter reading on October 10 was the same as it was on August 28 due to no heat or air conditioning demand toward the end of the period.
How Solar Panels Work
Solar photovoltaic (PV) panels contain individual solar cells that convert sunlight into electrical energy. The combined electricity produced by multiple cells within a solar panel forms the total electrical power available from that panel. Our 13 solar panels operate together to provide most of the electrical power required for use in our home. Since solar panels produce electricity from the sun, there is no energy production at night and production is reduced by cloudy skies. Also, more energy is produced in the summer when the daylight hours are longer. Some solar systems can be used with energy storage devices such as batteries that can store the electricity when sunlight is available, and then provide that energy for use later when sunlight is not available. Our system does not include energy storage, so the electricity produced is used by us and any excess is returned to the utility’s electrical grid. Solar panels require “inverters” to convert the direct current (DC) electricity produced by the panels into alternating current (AC) that can be used in the home; and they also require controllers to ensure electrical safety of the panels and the connected devices in the home and the electrical grid to which they are connected. The system also includes monitoring functions to report status of the system and the amount of energy produced.
Installation
The solar system installation took abut three hours. The solar panels and microinverters are mounted on rails which are attached to the roof above the garage. The installation crew marked the location of the roof trusses, installed the rail mounting hardware and flashing, mounted the rails, mounted the microinverters and AC cabling to the rails, connected the solar panel cables to the microinverters, and mounted the solar panels to the rails. The AC output from the solar panels goes through the roof into the attic and out through the side of the house to the box containing the circuit breaker for the panels and the monitoring and control hardware and then back through the wall into the main electrical panel in the garage.
This is a time lapse video of the solar panel installation:
Net Metering
Net metering is an electricity billing method that allows consumers who generate some of their own electricity to take advantage of that electricity anytime, instead of only when it is generated. This is particularly important with renewable energy systems that do not include energy storage devices. With net metering, the electric meter records the energy drawn from the utility or returned to the utility, depending on whether the energy produced is less or more than that consumed. The energy produced by the solar system is not metered by the utility, although the system monitoring and control equipment does track what is produced.
With net metering, there is no direct payment for the energy produced. The energy produced and consumed offsets the energy normally purchased from the utility. Any excess energy returned to the grid is recorded and used to offset (credit) future electric energy consumed. Thus net metering allows consumers to produce energy during the day and use the excess amount at night or excess energy produced during the summer can be used in winter. The net metering credits only last a year, so the customer does not receive credits for annual energy produced in excess of what is used.
Production Reporting
Enphase (the microinverter manufacturer) has both a web page and smartphone apps that display the system’s energy production. The information available is basically the same for both and includes bar chart displays of system energy production and a display of the energy produced by each solar panel. This information is not real time – it is updated several times per day so we really only know how much was generated through the previous day. These are the bar charts available:
- Daily (15 minute increment totals)
- Weekly (daily totals)
- Monthly (daily totals)
- Yearly (monthly totals)
The displays showing the energy produced for each panel include daily, monthly, and yearly totals. Several energy production screen captures are included in the Additional Images section below.
Our system’s daily energy production is publicly available online at https://enlighten.enphaseenergy.com/pv/public_systems/YBhH1887339/overview?preview=1. This information is not real time – it is updated several times per day.
Solar System Details
| Solar Panels | |
|---|---|
| Manufacturer | Silfab Solar |
| Model | SIL-320 BL |
| Module Power, DC | 320 W |
| Module Efficiency | 0.188 |
| Module Dimensions | 66.9" x 39.4" x 1.5" |
| Module Weight | 40.1 lbs |
| Warranty | 12/25 Years |
| Linear power performance guarantee | ≥ 82.6% after 30 years |
| Microinverters | |
|---|---|
| Manufacturer | Enphase |
| Model | IQ 7 |
| Maximum Continuous Output Power | 240 VA |
| Output Voltage | 240 V |
| Maximum Continuous Output Current | 1.0 A |
| Warranty | 25 Years |
Additional Information
Installer: Sigora Solar
Solar Panels: Silfab Solar SIL-320-BL
Microinverters: Enphase IQ 7A Microinverter
Monitoring and Control System: Enphase Envoy
Additional Images


Great post, Larry! Very informative.